Abstract
This report evaluates the irradiance stability of the Solar Simulator model XES-300S3 during long-duration continuous operation using two measurements: a 24-hour continuous measurement and a 6-hour manual measurement.
In the 24-hour measurement, gradual irradiance variation was observed together with an increase in pyranometer temperature. In contrast, the 6-hour measurement showed relatively stable irradiance behavior.
These results indicate that the long-term variation observed in the continuous measurement is likely influenced by the temperature characteristics of the pyranometer rather than instability of the light source output.
1. Purpose and Overview of the Measurement
This measurement was conducted to observe how irradiance changes over time when a Solar Simulator is operated continuously for an extended period.
In long-duration illumination tests and light-induced degradation experiments, illumination is often maintained for several hours to several tens of hours. Therefore, it is important to understand the time behavior of irradiance during long continuous operation.
The purpose of this measurement was to obtain actual measurement data describing the temporal behavior of irradiance during long-duration illumination.
Two types of measurements were performed.
• 24-hour continuous measurement (24H measurement)
The pyranometer was installed at the irradiation position and irradiance and sensor temperature were logged continuously for 24 hours.
• 6-hour measurement (6H measurement)
The pyranometer was placed at the irradiation position only at each measurement time, and irradiance was manually measured and recorded by the operator.
By comparing these two measurement results, the stability of irradiance during long-duration illumination was evaluated.
2. Measurement Conditions
Solar Simulator: SAN-EI XES-300S3
Reference Irradiance: 1 SUN (AM1.5G equivalent)
Irradiance Sensor: Pyranometer (Main / Sub)
Measurement Environment: Laboratory
Measurement Date: April. 17. 2026
Operator: Shinobu Ito、Akinori Takada
3. Behavior Observed in the 24H Measurement
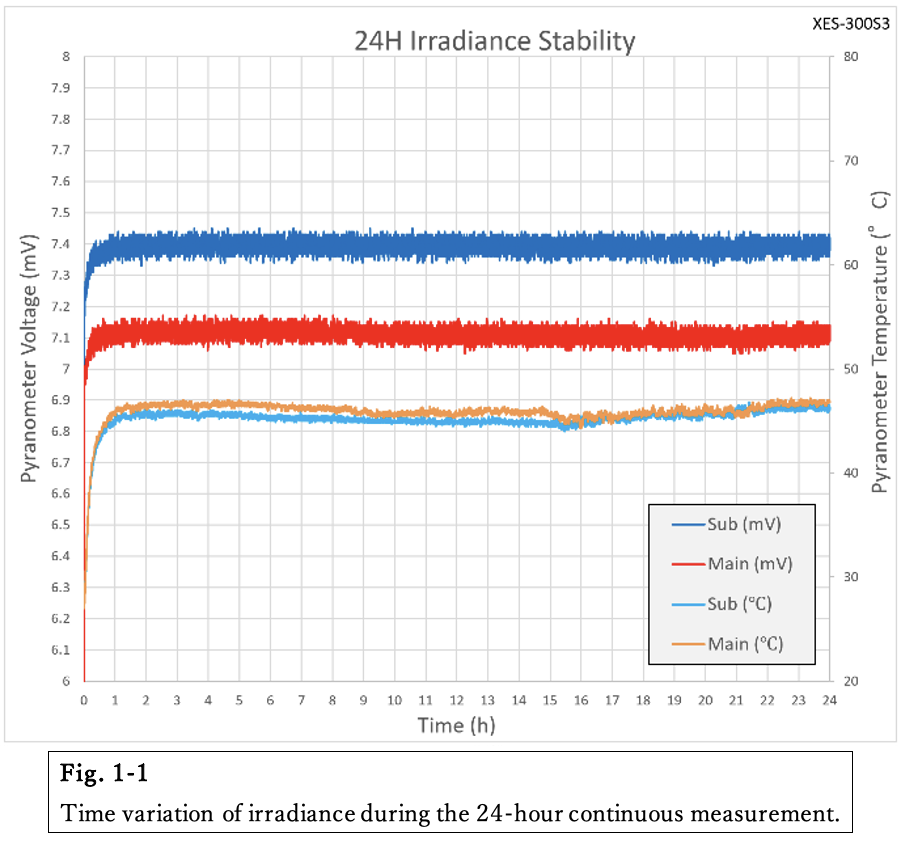
In the 24H measurement, both irradiance and pyranometer temperature exhibited characteristic time-dependent behavior (Fig. 1-1, Fig. 2).
Immediately after lamp ignition, relatively large changes were observed. Afterward, gradual changes continued for several hours, and the values eventually converged toward a nearly constant state after a long period of operation (Fig. 1-1).
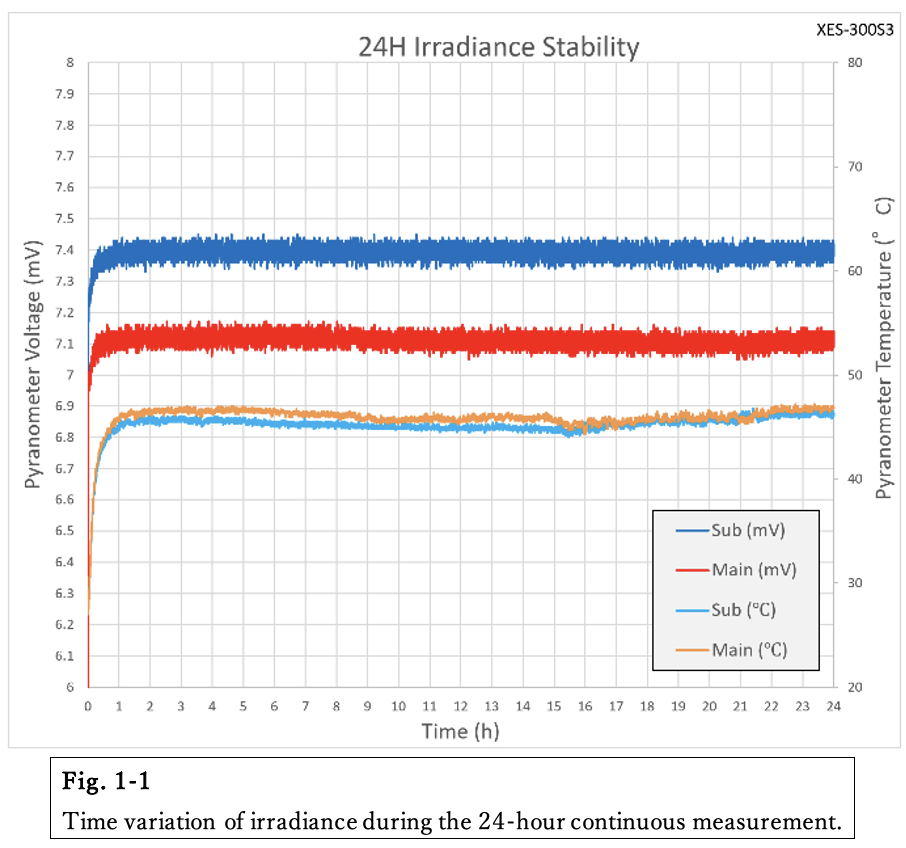
Two pyranometers, Main and Sub, were used in this measurement. Both sensors showed nearly identical temporal behavior.
This indicates that the observed variation is not caused by a malfunction of a single sensor but represents behavior common to the overall measurement system.
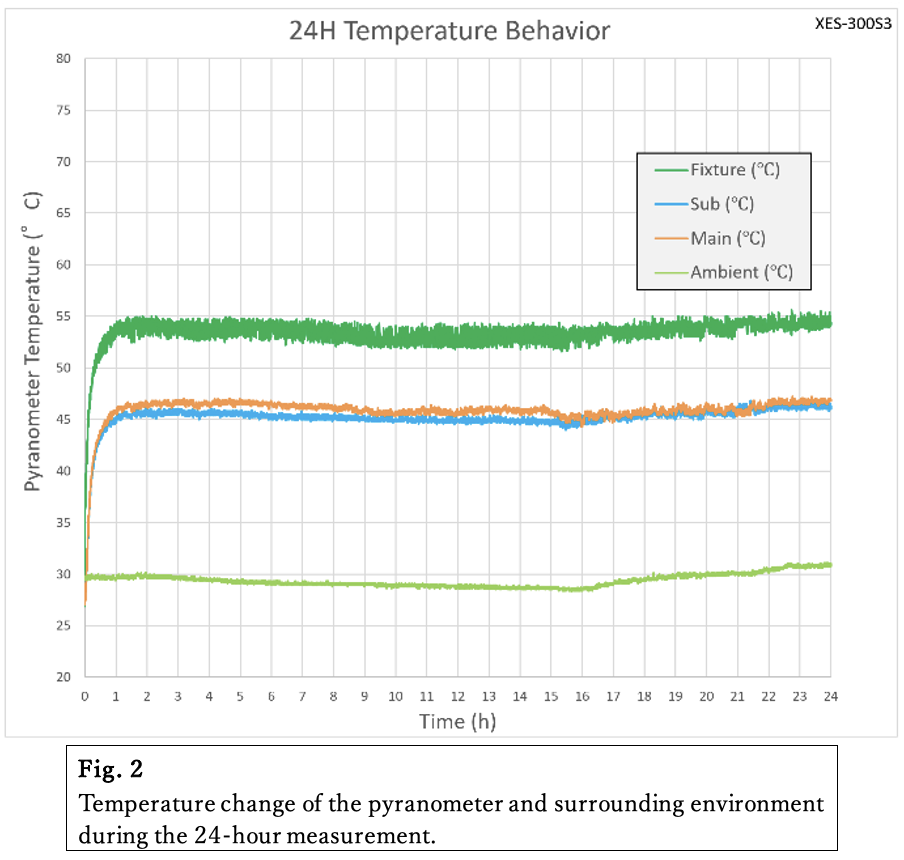
Observation of the pyranometer temperature and surrounding temperature shows that the temperature gradually increases over a long period after lamp ignition (Fig. 2).

At this stage, several possible causes of the observed behavior can be considered.
• Thermal equilibrium of the light source and power supply
• Thermal stabilization of the internal structure and optical system
• Temperature characteristics of the pyranometer
However, it is not possible at this stage to determine which factor is dominant.
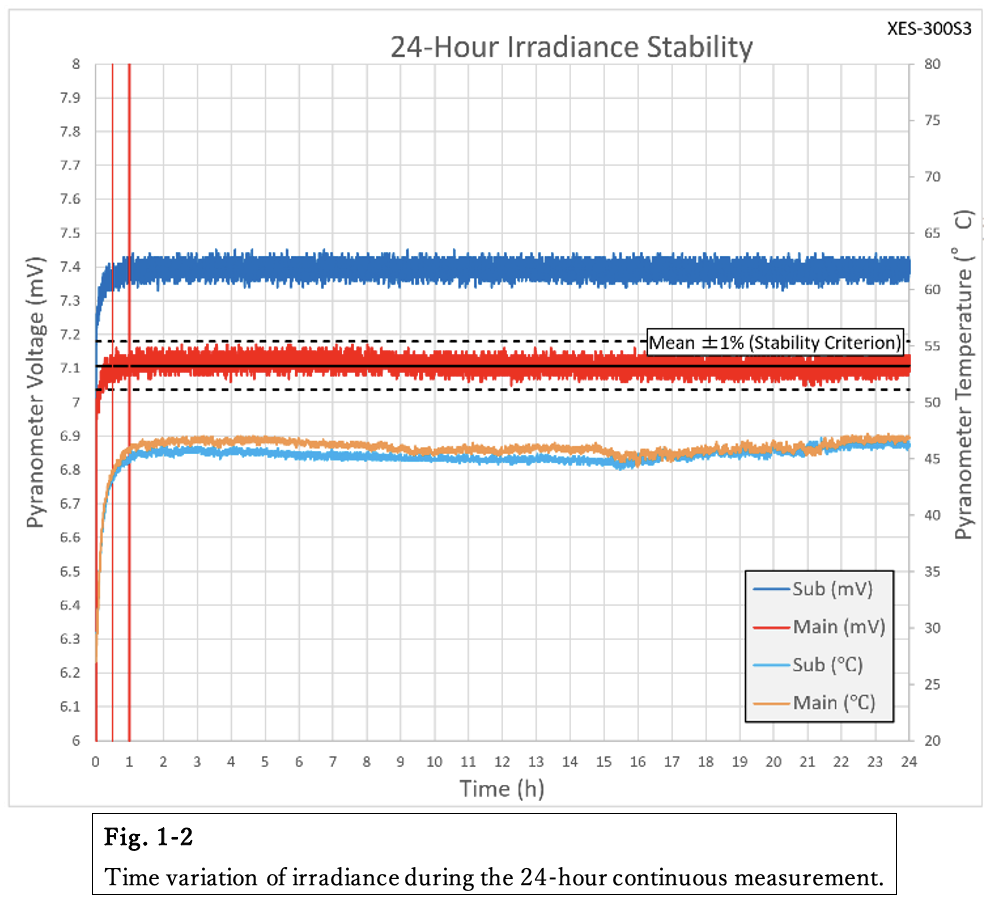
4. Classification of Time Behavior
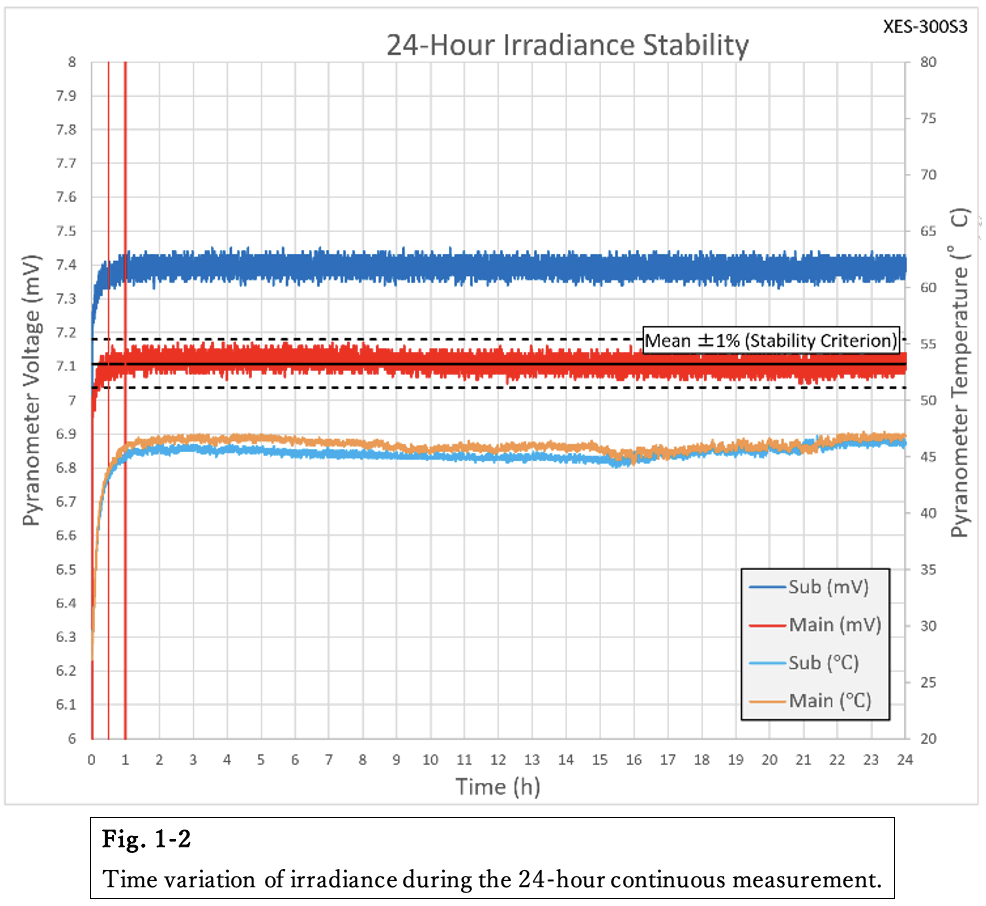
The time behavior observed in the 24H measurement can be interpreted by dividing it into three characteristic periods (Fig. 1-2).
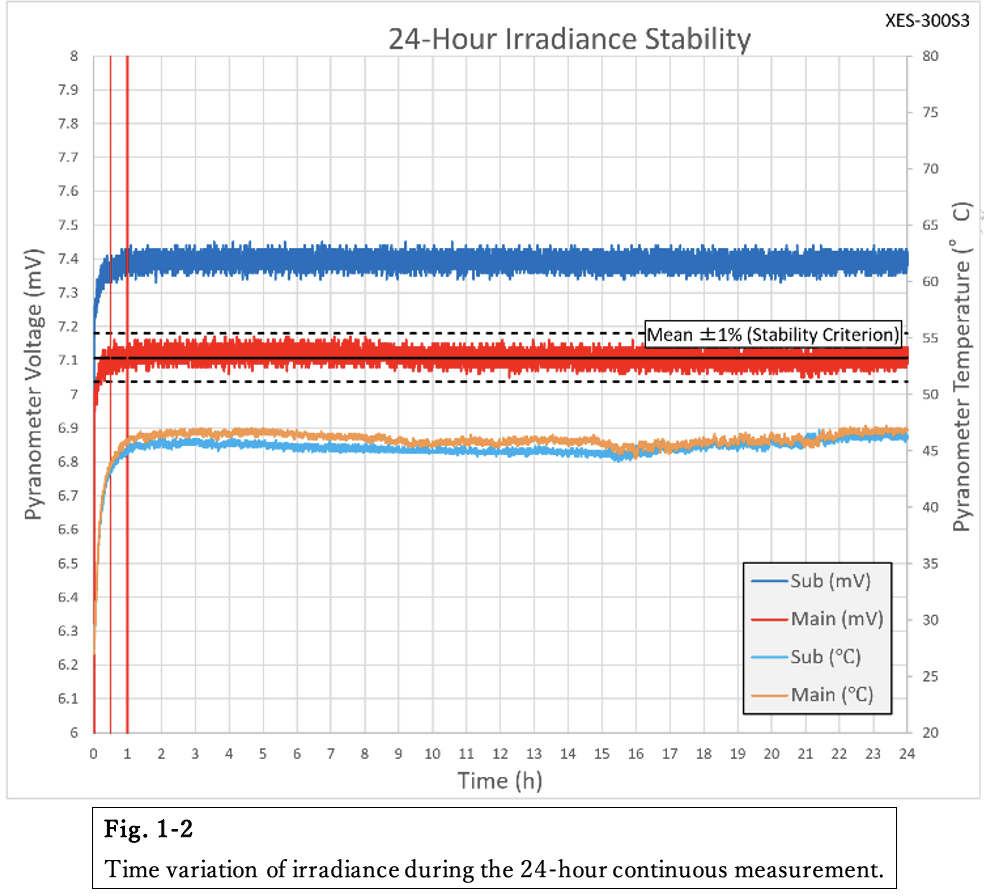
- Initial rise period (0 – approximately 2 hours)
Immediately after lamp ignition, when the light source, power supply, and internal temperature of the system change rapidly. - Transition period (approximately 2 – 14 hours)
A period during which the system gradually approaches thermal equilibrium and irradiance changes slowly. - Stable region (after approximately 14 hours)
A stable state in which both irradiance and pyranometer temperature become nearly constant.
In Fig. 1-2, the mean value in the stable region and its ±1% range are also indicated.
In this measurement, the period after approximately 14 hours is treated as the stable region for long-duration illumination.
This time may vary depending on system configuration and environmental conditions.
5. 6H Measurement to Investigate the Cause of the Initial Behavior
In the 24H measurement, gradual changes in irradiance were observed for a long time after lamp ignition (Fig. 1-2).
To investigate whether this change is caused by
- variation in the light source output
- temperature characteristics of the sensor
a different measurement method was applied as the 6H measurement.
In the 6H measurement, the pyranometer was not kept under continuous illumination but was placed at the irradiation position only at each measurement time.
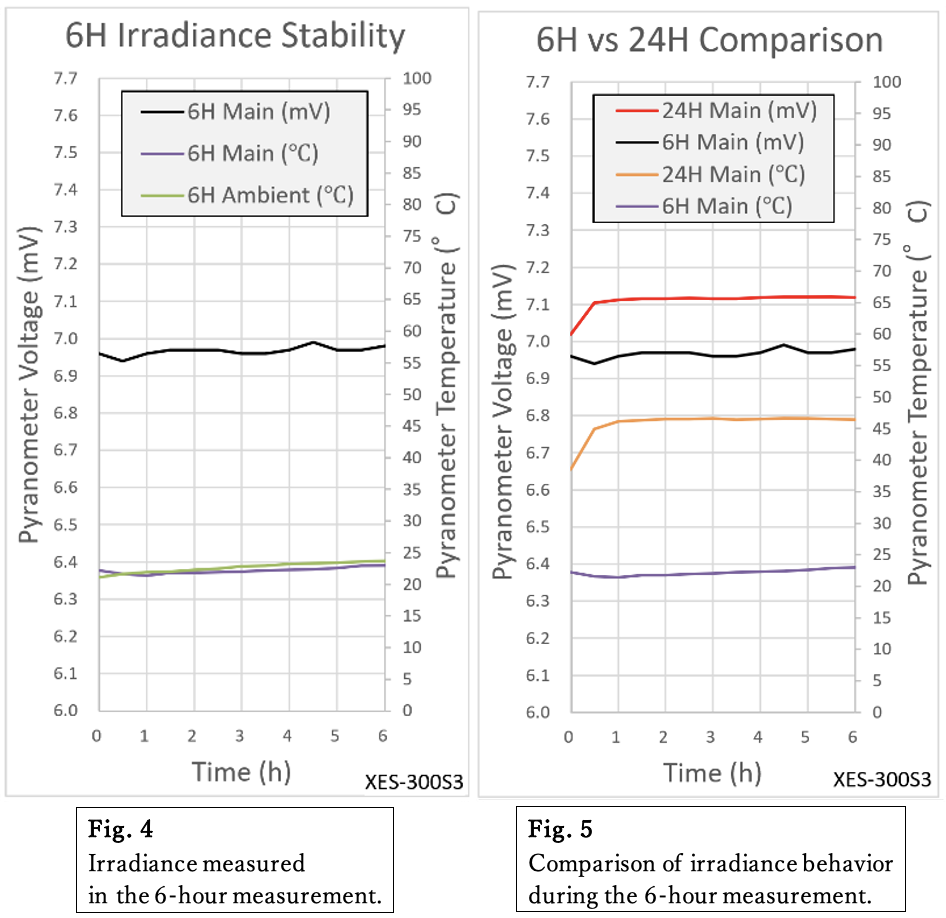
6. Findings from the 6H Measurement
In the 6H measurement, irradiance did not show significant temporal variation during the measurement period and remained relatively stable (Fig. 4).
In contrast, in the 24H measurement irradiance gradually changes together with the increase in pyranometer temperature (Fig. 5).
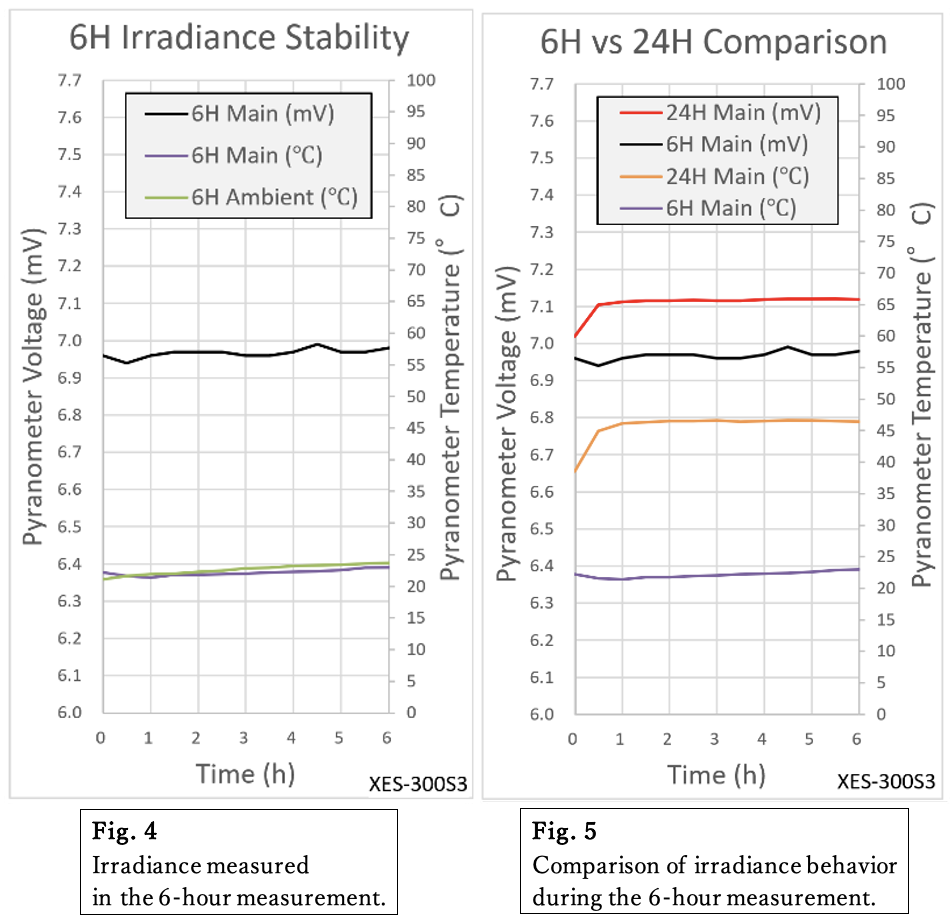
From this result, it can be considered that the long-term variation observed in the 24H measurement likely includes the influence of the temperature characteristics of the pyranometer.
If this behavior is interpreted from the perspective of the pyranometer, it can be regarded as a normal response of the measurement instrument including its temperature response.
From this viewpoint, the gradual change observed in the 24H measurement does not directly indicate instability of the light source output. Instead, it suggests that the light source itself may be relatively stable.
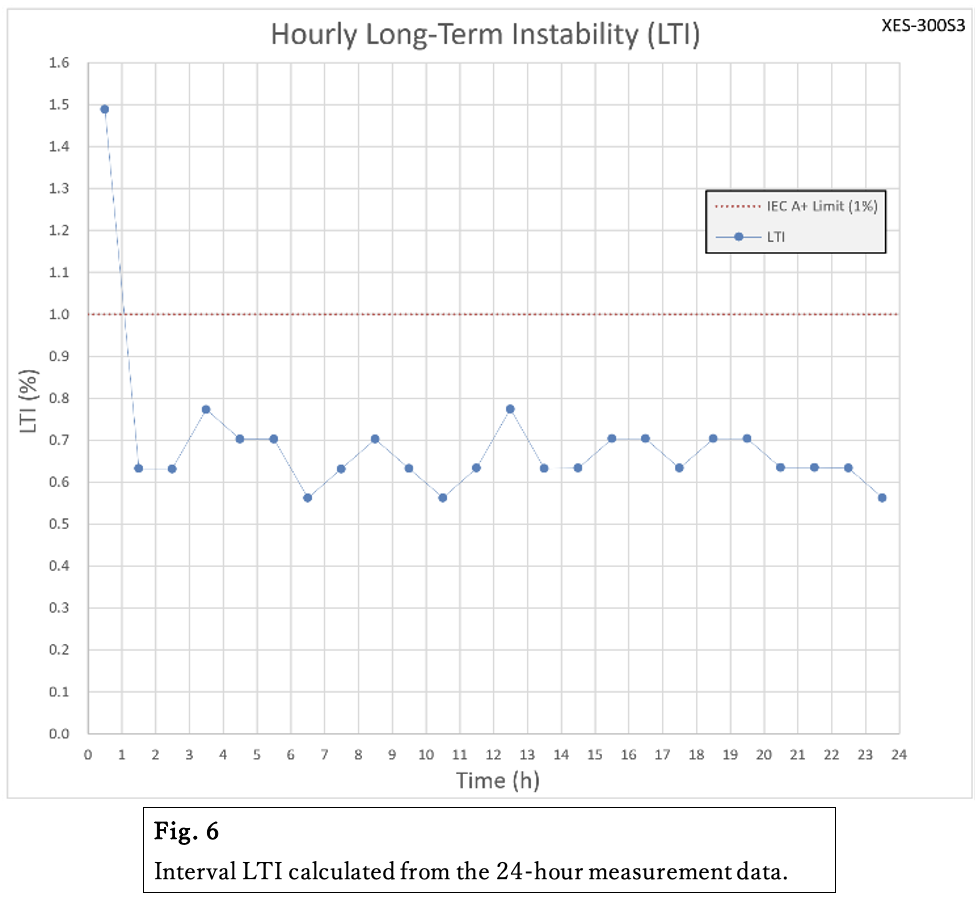
7. Verification Using Interval LTI Analysis
To further confirm this interpretation, the Long-Term Instability (LTI) was calculated for each one-hour interval using the 24H measurement data (Fig. 6).
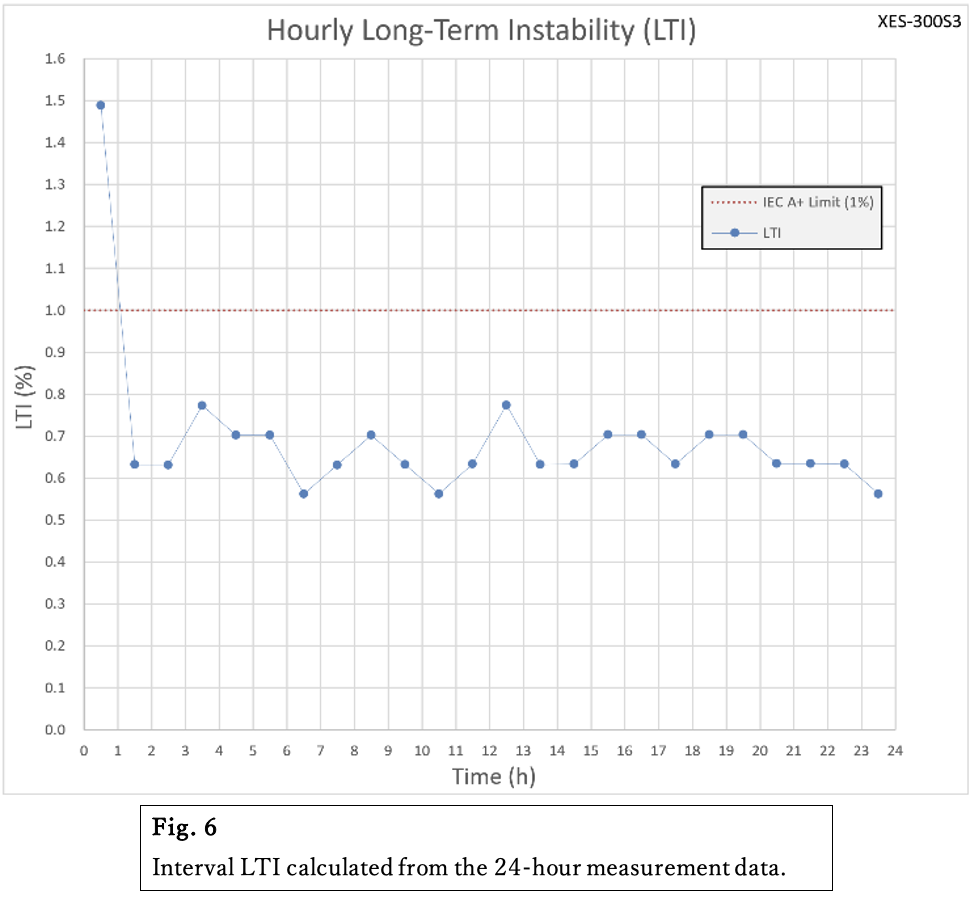
When the entire 24-hour dataset is observed, irradiance may appear unstable especially during the period up to around 14 hours (Fig. 1-2).
However, when evaluated in one-hour intervals, a different result is obtained.
The measurement results show that
- For all intervals after the first hour, LTI ≤ 1%
- Even in the first hour, LTI ≤ 2%
According to the temporal instability classification defined in IEC 60904-9:2020 - After the first hour: Class A+
- First hour: Class A
In addition, for the stable region (after approximately 14 hours) and the 6H measurement period, the time variation rate and drift relative to the mean value were calculated.
The results confirm that in both measurements the irradiance remains within ±1% of the mean value.
At SAN-EI, time stability measurements are normally performed after 1–2 hours of operation, when the system and measurement environment have reached thermal stability.
8. Understanding Derived from This Measurement
In this measurement, the temporal behavior of irradiance during long-duration continuous illumination of a Solar Simulator was observed and the stability of irradiance was evaluated.
In the 24H measurement, gradual changes in irradiance were observed for a long period after lamp ignition (Fig. 1-1).
The pyranometer temperature and surrounding temperature were also observed to change gradually over time (Fig. 2).
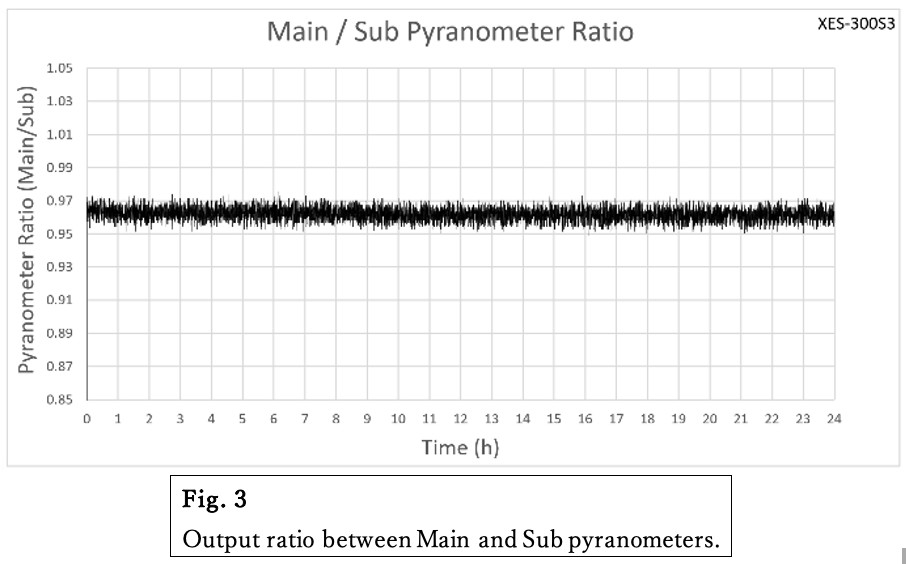
The output ratio of the two pyranometers (Main and Sub) did not change significantly over time, indicating that both sensors showed nearly identical behavior (Fig. 3).
In contrast, in the 6H measurement the pyranometer was placed at the irradiation position only during each measurement. Under this condition, irradiance did not show large temporal variation and remained relatively stable during the measurement period (Fig. 4, Fig. 5).
Furthermore, interval LTI analysis shows that for all periods after the first hour the time instability is ≤ 1%, confirming high stability (Fig. 6).
These results indicate that the gradual change in irradiance observed in the 24H measurement does not directly indicate instability of the light source output.
Instead, it is highly likely that this behavior includes the influence of sensor temperature characteristics, such as changes in pyranometer temperature during long-duration illumination.
If the influence of pyranometer temperature change is excluded, the irradiance behavior is expected to correspond to the stable condition observed after approximately 14 hours of operation (Fig. 1-2).
These results are consistent with the time stability classification defined in IEC 60904-9.
9. Measurement Data
This page provides the measured values and graphs obtained in the test.
Raw data (CSV) are available for members.
Download CSV– Members only